
Freight data · Shipping costs
Trucking and Warehousing Producer Price Indexes
How the prices trucking companies and warehouses receive have moved, from the U.S. Bureau of Labor Statistics. These are price indexes, not quotes: they show direction and relative change.
Dataset · Primary official statistics
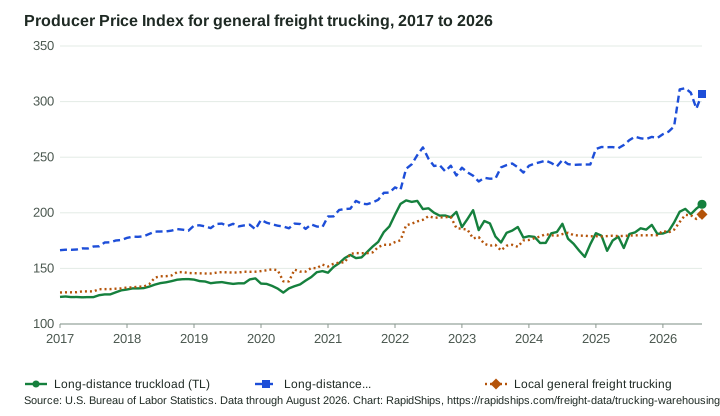
Producer Price Index for general freight trucking, 2017 to 2026
In short: Monthly BLS Producer Price Indexes for three general freight trucking industries: long-distance truckload, long-distance less-than-truckload and local trucking, January 2017 to August 2026. Latest: Long-distance truckload (TL), August 2026: 207.644, published by the U.S. Bureau of Labor Statistics.
- Fact207.644Long-distance truckload (TL)August 2026 preliminary · Index (Dec 2003 = 100)
- RapidShips analysis+13.9%Change from August 2025(207.644 ÷ 182.330) − 1
- CoverageJan 2017 to Aug 2026United StatesMonthly data
- Long-distance truckload (TL)
- Long-distance less-than-truckload (LTL)
- Local general freight trucking
Data table: all 116 months
| Month | Long-distance truckload (TL) | Long-distance less-than-truckload (LTL) | Local general freight trucking |
|---|---|---|---|
| August 2026 | 207.644 p | 306.839 p | 198.606 p |
| July 2026 | 203.781 p | 293.695 p | 194.424 p |
| June 2026 | 198.768 p | 307.961 p | 197.848 p |
| May 2026 | 203.536 p | 312.051 p | 198.110 p |
| April 2026 | 200.958 | 310.995 | 191.753 |
| March 2026 | 191.312 | 277.741 | 184.835 |
| February 2026 | 183.307 | 272.923 | 182.293 |
| January 2026 | 181.359 | 270.648 | 183.779 |
| December 2025 | 181.077 | 267.294 | 179.832 |
| November 2025 | 189.108 | 268.211 | 179.893 |
| October 2025 | 184.899 | 266.342 | 179.796 |
| September 2025 | 186.058 | 267.001 | 179.749 |
| August 2025 | 182.330 | 268.431 | 179.803 |
| July 2025 | 180.906 | 265.420 | 179.509 |
| June 2025 | 168.388 | 261.013 | 179.217 |
| May 2025 | 178.512 | 258.130 | 179.069 |
| April 2025 | 175.089 | 259.125 | 179.431 |
| March 2025 | 165.826 | 259.005 | 179.050 |
| February 2025 | 179.387 | 259.215 | 178.704 |
| January 2025 | 181.652 | 257.376 | 178.951 |
| December 2024 | 171.718 | 243.422 | 178.892 |
| November 2024 | 160.349 | 243.394 | 179.451 |
| October 2024 | 165.925 | 243.330 | 179.512 |
| September 2024 | 172.163 | 243.046 | 179.902 |
| August 2024 | 176.722 | 243.762 | 182.016 |
| July 2024 | 190.065 | 247.454 | 180.861 |
| June 2024 | 182.698 | 241.732 | 179.436 |
| May 2024 | 181.575 | 244.791 | 179.802 |
| April 2024 | 172.961 | 246.943 | 180.851 |
| March 2024 | 172.822 | 245.484 | 178.643 |
| February 2024 | 178.320 | 244.230 | 177.198 |
| January 2024 | 178.925 | 242.245 | 175.510 |
| December 2023 | 177.712 | 236.187 | 175.164 |
| November 2023 | 187.206 | 240.901 | 169.445 |
| October 2023 | 184.002 | 244.315 | 171.217 |
| September 2023 | 182.025 | 242.879 | 170.430 |
| August 2023 | 173.268 | 240.812 | 166.151 |
| July 2023 | 178.666 | 230.773 | 171.156 |
| June 2023 | 190.471 | 230.664 | 170.436 |
| May 2023 | 192.615 | 231.510 | 172.124 |
| April 2023 | 184.407 | 228.176 | 178.154 |
| March 2023 | 202.307 | 233.331 | 176.984 |
| February 2023 | 194.459 | 236.298 | 184.804 |
| January 2023 | 187.156 | 240.539 | 185.642 |
| December 2022 | 200.778 | 233.568 | 186.272 |
| November 2022 | 195.947 | 242.376 | 196.340 |
| October 2022 | 197.549 | 237.312 | 196.088 |
| September 2022 | 197.526 | 242.930 | 195.778 |
| August 2022 | 200.068 | 242.100 | 195.523 |
| July 2022 | 204.018 | 248.576 | 196.940 |
| June 2022 | 203.350 | 258.802 | 193.701 |
| May 2022 | 210.733 | 251.869 | 192.282 |
| April 2022 | 209.823 | 243.598 | 190.187 |
| March 2022 | 211.126 | 239.535 | 188.753 |
| February 2022 | 208.028 | 220.690 | 175.226 |
| January 2022 | 198.275 | 222.856 | 173.654 |
| December 2021 | 187.738 | 218.148 | 171.229 |
| November 2021 | 182.629 | 217.984 | 171.242 |
| October 2021 | 173.847 | 211.703 | 169.190 |
| September 2021 | 169.568 | 209.299 | 164.407 |
| August 2021 | 164.691 | 207.759 | 163.714 |
| July 2021 | 159.929 | 208.302 | 163.692 |
| June 2021 | 159.300 | 210.700 | 163.800 |
| May 2021 | 162.100 | 203.700 | 163.100 |
| April 2021 | 159.300 | 203.400 | 155.400 |
| March 2021 | 154.700 | 202.500 | 155.200 |
| February 2021 | 151.300 | 196.800 | 154.100 |
| January 2021 | 146.100 | 196.700 | 151.700 |
| December 2020 | 147.600 | 187.100 | 153.400 |
| November 2020 | 146.600 | 187.700 | 150.200 |
| October 2020 | 142.200 | 189.600 | 150.400 |
| September 2020 | 139.000 | 185.500 | 147.100 |
| August 2020 | 135.600 | 189.900 | 147.100 |
| July 2020 | 134.000 | 190.300 | 148.900 |
| June 2020 | 132.000 | 186.100 | 138.300 |
| May 2020 | 128.200 | 187.700 | 138.400 |
| April 2020 | 131.800 | 188.400 | 148.400 |
| March 2020 | 134.300 | 189.700 | 149.200 |
| February 2020 | 136.100 | 191.100 | 148.300 |
| January 2020 | 136.300 | 193.600 | 147.600 |
| December 2019 | 141.000 | 185.200 | 147.000 |
| November 2019 | 140.100 | 189.300 | 146.900 |
| October 2019 | 136.600 | 188.700 | 147.000 |
| September 2019 | 136.600 | 187.800 | 146.300 |
| August 2019 | 136.100 | 190.100 | 146.300 |
| July 2019 | 136.800 | 188.100 | 146.400 |
| June 2019 | 137.700 | 190.300 | 146.700 |
| May 2019 | 137.300 | 189.900 | 146.100 |
| April 2019 | 136.700 | 186.200 | 145.400 |
| March 2019 | 138.200 | 187.800 | 145.400 |
| February 2019 | 138.600 | 188.800 | 145.600 |
| January 2019 | 139.900 | 188.500 | 145.700 |
| December 2018 | 140.400 | 183.900 | 145.900 |
| November 2018 | 140.300 | 184.800 | 146.700 |
| October 2018 | 139.800 | 185.300 | 146.700 |
| September 2018 | 138.600 | 184.000 | 143.700 |
| August 2018 | 137.500 | 183.300 | 143.000 |
| July 2018 | 136.800 | 183.200 | 142.900 |
| June 2018 | 135.400 | 183.100 | 141.700 |
| May 2018 | 133.600 | 181.000 | 135.900 |
| April 2018 | 132.300 | 178.900 | 133.600 |
| March 2018 | 132.000 | 178.400 | 133.600 |
| February 2018 | 132.000 | 178.500 | 132.900 |
| January 2018 | 131.000 | 177.400 | 132.800 |
| December 2017 | 130.300 | 175.500 | 132.000 |
| November 2017 | 128.500 | 175.100 | 131.700 |
| October 2017 | 126.600 | 173.500 | 131.400 |
| September 2017 | 126.600 | 173.300 | 131.400 |
| August 2017 | 125.900 | 169.900 | 131.300 |
| July 2017 | 124.200 | 169.700 | 129.300 |
| June 2017 | 124.200 | 167.900 | 129.300 |
| May 2017 | 124.000 | 168.000 | 129.300 |
| April 2017 | 124.300 | 167.000 | 128.600 |
| March 2017 | 124.200 | 166.700 | 128.500 |
| February 2017 | 124.700 | 166.800 | 128.500 |
| January 2017 | 124.400 | 166.400 | 128.300 |
p = preliminary, as flagged by the source.
- Source
- U.S. Bureau of Labor Statistics Primary official statistics
Series PCU484121484121, PCU484122484122, PCU484110484110; BLS Public Data API, version 2 (timeseries data); Release schedule: Producer Price Index - Date range
- January 2017 to August 2026
- Last verified
- September 30, 2026 (values re-checked against the source by the build)
- Update frequency
- Monthly. Next expected: October 15, 2026.
- Geography
- United States
- Unit
- index, December 2003 = 100
- Methodology
- How the figures were collected and the Data Center methodology
- Limitations
- What this data cannot tell you
- Licence
- U.S. federal government work in the public domain. BLS asks that it be cited as the source. Terms
Cite this data
RapidShips. "Producer Price Index for general freight trucking, 2017 to 2026." Data period January 2017 to August 2026. Source: U.S. Bureau of Labor Statistics, Producer Price Index (industry data) (https://data.bls.gov/timeseries/PCU484121484121). RapidShips Freight Data: https://rapidships.com/freight-data/trucking-warehousing-price-indexes/#ds-bls-ppi-trucking. Retrieved September 30, 2026; last updated September 30, 2026.
Download: CSV JSON U.S. federal government work in the public domain. BLS asks that it be cited as the source.
How the figures were collected
- Series PCU484121484121 (general freight trucking, long-distance TL), PCU484122484122 (long-distance LTL) and PCU484110484110 (local), not seasonally adjusted, base December 2003 = 100, downloaded from the BLS Public Data API.
- The PPI "measures the average change over time in the selling prices received by domestic producers for their output."
- Values are shown exactly as BLS publishes them, including the precision BLS uses (one decimal for older months, three for recent months). Year-over-year changes are RapidShips analysis, calculated from two published index values.
Limitations
- BLS footnote on the latest four months: "Preliminary. All indexes are subject to monthly revisions up to four months after original publication."
- An index shows direction and relative change, not a price. It cannot tell you what a truckload from Newark to Chicago costs.
- National figures. BLS does not publish these trucking indexes for New Jersey or for a single lane.
- Not seasonally adjusted: compare the same month across years rather than one month with the next.
Use this data
- GlossaryFull Truckload
- GlossaryLess-Than-Truckload
- AnswerHow Is LTL Freight Priced?
- AnswerLTL vs. FTL: Which Should You Use?
- RapidShips serviceCross-Docking in East Brunswick, NJ
- Freight toolFreight Class & Density Calculator
- Freight toolDimensional Weight Calculator
- GlossaryAccessorial Charge
- GlossaryFreight Class
Dataset · Primary official statistics
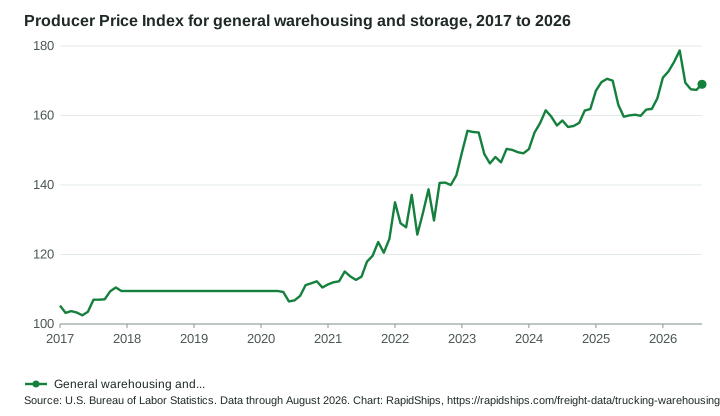
Producer Price Index for general warehousing and storage, 2017 to 2026
In short: Monthly BLS Producer Price Index for general warehousing and storage (NAICS 493110), January 2017 to August 2026. Latest: General warehousing and storage, August 2026: 168.967, published by the U.S. Bureau of Labor Statistics.
- Fact168.967General warehousing and storageAugust 2026 preliminary · Index (Dec 2003 = 100)
- RapidShips analysis+5.4%Change from August 2025(168.967 ÷ 160.236) − 1
- CoverageJan 2017 to Aug 2026United StatesMonthly data
- General warehousing and storage
Data table: all 116 months
| Month | General warehousing and storage |
|---|---|
| August 2026 | 168.967 p |
| July 2026 | 167.364 p |
| June 2026 | 167.544 p |
| May 2026 | 169.441 p |
| April 2026 | 178.706 |
| March 2026 | 175.415 |
| February 2026 | 172.704 |
| January 2026 | 170.917 |
| December 2025 | 164.880 |
| November 2025 | 161.896 |
| October 2025 | 161.698 |
| September 2025 | 159.905 |
| August 2025 | 160.236 |
| July 2025 | 160.030 |
| June 2025 | 159.668 |
| May 2025 | 163.081 |
| April 2025 | 170.009 |
| March 2025 | 170.556 |
| February 2025 | 169.620 |
| January 2025 | 167.142 |
| December 2024 | 161.839 |
| November 2024 | 161.444 |
| October 2024 | 157.863 |
| September 2024 | 156.988 |
| August 2024 | 156.677 |
| July 2024 | 158.571 |
| June 2024 | 157.123 |
| May 2024 | 159.691 |
| April 2024 | 161.487 |
| March 2024 | 157.813 |
| February 2024 | 155.065 |
| January 2024 | 150.344 |
| December 2023 | 149.108 |
| November 2023 | 149.440 |
| October 2023 | 150.088 |
| September 2023 | 150.389 |
| August 2023 | 146.543 |
| July 2023 | 148.066 |
| June 2023 | 146.229 |
| May 2023 | 148.924 |
| April 2023 | 155.102 |
| March 2023 | 155.248 |
| February 2023 | 155.610 |
| January 2023 | 149.322 |
| December 2022 | 142.826 |
| November 2022 | 139.988 |
| October 2022 | 140.691 |
| September 2022 | 140.594 |
| August 2022 | 129.782 |
| July 2022 | 138.763 |
| June 2022 | 131.922 |
| May 2022 | 125.739 |
| April 2022 | 137.180 |
| March 2022 | 127.831 |
| February 2022 | 128.995 |
| January 2022 | 135.008 |
| December 2021 | 124.514 |
| November 2021 | 120.505 |
| October 2021 | 123.609 |
| September 2021 | 119.613 |
| August 2021 | 117.951 |
| July 2021 | 113.623 |
| June 2021 | 112.700 |
| May 2021 | 113.700 |
| April 2021 | 115.100 |
| March 2021 | 112.300 |
| February 2021 | 112.000 |
| January 2021 | 111.400 |
| December 2020 | 110.500 |
| November 2020 | 112.300 |
| October 2020 | 111.700 |
| September 2020 | 111.200 |
| August 2020 | 108.100 |
| July 2020 | 106.800 |
| June 2020 | 106.500 |
| May 2020 | 109.200 |
| April 2020 | 109.500 |
| March 2020 | 109.500 |
| February 2020 | 109.500 |
| January 2020 | 109.500 |
| December 2019 | 109.500 |
| November 2019 | 109.500 |
| October 2019 | 109.500 |
| September 2019 | 109.500 |
| August 2019 | 109.500 |
| July 2019 | 109.500 |
| June 2019 | 109.500 |
| May 2019 | 109.500 |
| April 2019 | 109.500 |
| March 2019 | 109.500 |
| February 2019 | 109.500 |
| January 2019 | 109.500 |
| December 2018 | 109.500 |
| November 2018 | 109.500 |
| October 2018 | 109.500 |
| September 2018 | 109.500 |
| August 2018 | 109.500 |
| July 2018 | 109.500 |
| June 2018 | 109.500 |
| May 2018 | 109.500 |
| April 2018 | 109.500 |
| March 2018 | 109.500 |
| February 2018 | 109.500 |
| January 2018 | 109.500 |
| December 2017 | 109.500 |
| November 2017 | 110.500 |
| October 2017 | 109.400 |
| September 2017 | 107.100 |
| August 2017 | 107.000 |
| July 2017 | 107.000 |
| June 2017 | 103.500 |
| May 2017 | 102.500 |
| April 2017 | 103.300 |
| March 2017 | 103.700 |
| February 2017 | 103.200 |
| January 2017 | 105.300 |
p = preliminary, as flagged by the source.
- Source
- U.S. Bureau of Labor Statistics Primary official statistics
Series PCU493110493110; BLS Public Data API, version 2 (timeseries data); Release schedule: Producer Price Index - Date range
- January 2017 to August 2026
- Last verified
- September 30, 2026 (values re-checked against the source by the build)
- Update frequency
- Monthly. Next expected: October 15, 2026.
- Geography
- United States
- Unit
- index, December 2003 = 100
- Methodology
- How the figures were collected and the Data Center methodology
- Limitations
- What this data cannot tell you
- Licence
- U.S. federal government work in the public domain. BLS asks that it be cited as the source. Terms
Cite this data
RapidShips. "Producer Price Index for general warehousing and storage, 2017 to 2026." Data period January 2017 to August 2026. Source: U.S. Bureau of Labor Statistics, Producer Price Index (industry data) (https://data.bls.gov/timeseries/PCU493110493110). RapidShips Freight Data: https://rapidships.com/freight-data/trucking-warehousing-price-indexes/#ds-bls-ppi-warehousing. Retrieved September 30, 2026; last updated September 30, 2026.
Download: CSV JSON U.S. federal government work in the public domain. BLS asks that it be cited as the source.
How the figures were collected
- Series PCU493110493110, general warehousing and storage, not seasonally adjusted, base December 2003 = 100, from the BLS Public Data API.
- It tracks the prices warehouses receive for storage and related services. Year-over-year changes are RapidShips analysis.
Limitations
- BLS footnote on the latest four months: "Preliminary. All indexes are subject to monthly revisions up to four months after original publication."
- A national index: it is not a New Jersey storage rate and it does not tell you what a pallet position costs.
- Not seasonally adjusted: compare the same month across years.