
Freight data · Transportation
Freight Transportation Services Index (TSI)
A monthly measure of how much freight the U.S. for-hire transportation industry carries, from the Bureau of Transportation Statistics.
Dataset · Primary official statistics
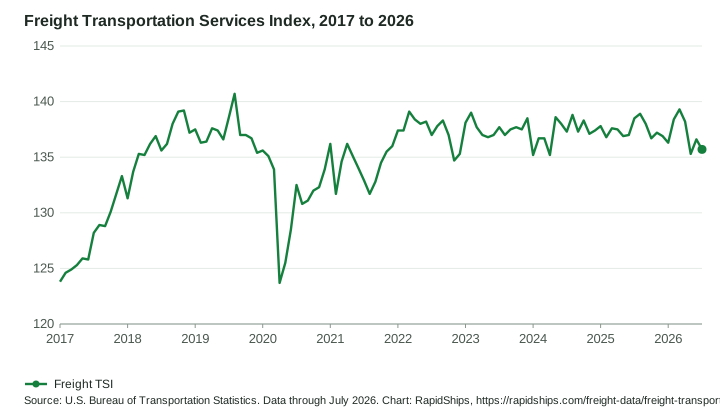
Freight Transportation Services Index, 2017 to 2026
In short: The BTS Freight Transportation Services Index, a monthly, seasonally adjusted measure of the freight carried by the for-hire transportation industry in the United States, January 2017 to July 2026. Latest: Freight TSI, July 2026: 135.7, published by the U.S. Bureau of Transportation Statistics.
- Fact135.7Freight TSIJuly 2026 · Index (2000 = 100)
- RapidShips analysis−2.0%Change from July 2025(135.7 ÷ 138.5) − 1
- CoverageJan 2017 to Jul 2026United StatesMonthly data
- Freight TSI
Data table: all 115 months
| Month | Freight TSI |
|---|---|
| July 2026 | 135.7 |
| June 2026 | 136.6 |
| May 2026 | 135.3 |
| April 2026 | 138.2 |
| March 2026 | 139.3 |
| February 2026 | 138.4 |
| January 2026 | 136.3 |
| December 2025 | 136.9 |
| November 2025 | 137.2 |
| October 2025 | 136.7 |
| September 2025 | 138.0 |
| August 2025 | 138.9 |
| July 2025 | 138.5 |
| June 2025 | 137.0 |
| May 2025 | 136.9 |
| April 2025 | 137.5 |
| March 2025 | 137.6 |
| February 2025 | 136.8 |
| January 2025 | 137.8 |
| December 2024 | 137.4 |
| November 2024 | 137.1 |
| October 2024 | 138.3 |
| September 2024 | 137.3 |
| August 2024 | 138.8 |
| July 2024 | 137.3 |
| June 2024 | 138.0 |
| May 2024 | 138.6 |
| April 2024 | 135.2 |
| March 2024 | 136.7 |
| February 2024 | 136.7 |
| January 2024 | 135.2 |
| December 2023 | 138.5 |
| November 2023 | 137.5 |
| October 2023 | 137.7 |
| September 2023 | 137.5 |
| August 2023 | 137.0 |
| July 2023 | 137.7 |
| June 2023 | 137.0 |
| May 2023 | 136.8 |
| April 2023 | 137.0 |
| March 2023 | 137.7 |
| February 2023 | 139.0 |
| January 2023 | 138.1 |
| December 2022 | 135.3 |
| November 2022 | 134.7 |
| October 2022 | 137.0 |
| September 2022 | 138.3 |
| August 2022 | 137.8 |
| July 2022 | 137.0 |
| June 2022 | 138.2 |
| May 2022 | 138.0 |
| April 2022 | 138.4 |
| March 2022 | 139.1 |
| February 2022 | 137.4 |
| January 2022 | 137.4 |
| December 2021 | 136.0 |
| November 2021 | 135.5 |
| October 2021 | 134.5 |
| September 2021 | 132.8 |
| August 2021 | 131.7 |
| July 2021 | 132.9 |
| June 2021 | 134.0 |
| May 2021 | 135.1 |
| April 2021 | 136.2 |
| March 2021 | 134.6 |
| February 2021 | 131.7 |
| January 2021 | 136.2 |
| December 2020 | 133.9 |
| November 2020 | 132.3 |
| October 2020 | 132.0 |
| September 2020 | 131.1 |
| August 2020 | 130.8 |
| July 2020 | 132.5 |
| June 2020 | 128.5 |
| May 2020 | 125.5 |
| April 2020 | 123.7 |
| March 2020 | 133.9 |
| February 2020 | 135.1 |
| January 2020 | 135.6 |
| December 2019 | 135.4 |
| November 2019 | 136.7 |
| October 2019 | 137.0 |
| September 2019 | 137.0 |
| August 2019 | 140.7 |
| July 2019 | 138.6 |
| June 2019 | 136.6 |
| May 2019 | 137.4 |
| April 2019 | 137.6 |
| March 2019 | 136.4 |
| February 2019 | 136.3 |
| January 2019 | 137.5 |
| December 2018 | 137.2 |
| November 2018 | 139.2 |
| October 2018 | 139.1 |
| September 2018 | 138.0 |
| August 2018 | 136.2 |
| July 2018 | 135.6 |
| June 2018 | 136.9 |
| May 2018 | 136.2 |
| April 2018 | 135.2 |
| March 2018 | 135.3 |
| February 2018 | 133.7 |
| January 2018 | 131.3 |
| December 2017 | 133.3 |
| November 2017 | 131.7 |
| October 2017 | 130.1 |
| September 2017 | 128.8 |
| August 2017 | 128.9 |
| July 2017 | 128.2 |
| June 2017 | 125.8 |
| May 2017 | 125.9 |
| April 2017 | 125.3 |
| March 2017 | 124.9 |
| February 2017 | 124.6 |
| January 2017 | 123.8 |
- Source
- U.S. Bureau of Transportation Statistics Primary official statistics
Transportation Services Index and Seasonally-Adjusted Transportation...; The July 2026 Freight Transportation Services Index (TSI) Fell 0.7%... - Date range
- January 2017 to July 2026
- Last verified
- September 30, 2026 (values re-checked against the source by the build)
- Update frequency
- Monthly. Next expected: October 14, 2026.
- Geography
- United States
- Unit
- index, 2000 average = 100, seasonally adjusted
- Methodology
- How the figures were collected and the Data Center methodology
- Limitations
- What this data cannot tell you
- Licence
- Public Domain U.S. Government, as stated on the BTS dataset. Terms
Cite this data
RapidShips. "Freight Transportation Services Index, 2017 to 2026." Data period January 2017 to July 2026. Source: U.S. Department of Transportation, Bureau of Transportation Statistics, Transportation Services Index (https://data.bts.gov/Research-and-Statistics/Transportation-Services-Index-and-Seasonally-Adjus/bw6n-ddqk). RapidShips Freight Data: https://rapidships.com/freight-data/freight-transportation-services-index/#ds-bts-freight-tsi. Retrieved September 30, 2026; last updated September 30, 2026.
Download: CSV JSON Public Domain U.S. Government, as stated on the BTS dataset.
How the figures were collected
- Column TSI_Freight of the BTS dataset "Transportation Services Index and Seasonally-Adjusted Transportation Data" on data.bts.gov, which BTS describes as "a weighted average of monthly data for trucking, freight rail, waterborne, pipeline, and air freight."
- The index is seasonally adjusted, so one month can be compared with the next. Its reference base is 2000 = 100: RapidShips checked that the twelve 2000 values in the dataset average 100.0.
- Changes are RapidShips analysis, calculated from the published values.
Limitations
- BTS revises the index as inputs are updated and seasonal factors change; its July 2026 release revised June from 134.9 to 136.6. Always check the current dataset.
- For the latest month BTS estimates pipeline and air freight one month ahead of reported data, and it estimated waterborne data for July 2026.
- It measures domestic for-hire freight only. It excludes international or coastal waterborne movements, private trucking, courier services and the Postal Service, so it is not a measure of port activity.
- National, not New Jersey.