
Freight data · New Jersey
New Jersey Freight Employment: Warehousing and Trucking Jobs
How many people work in New Jersey warehousing and trucking, month by month, from the Bureau of Labor Statistics. Not seasonally adjusted, so compare the same month across years.
Dataset · Primary official statistics
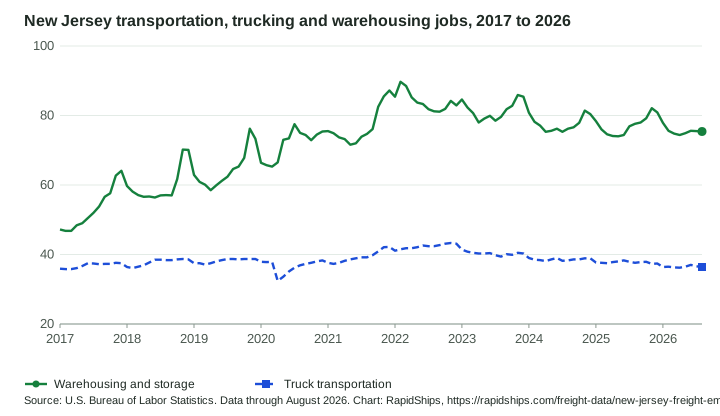
New Jersey transportation, trucking and warehousing jobs, 2017 to 2026
In short: Monthly BLS Current Employment Statistics for New Jersey: all employees in transportation, warehousing and utilities, in truck transportation, and in warehousing and storage, January 2017 to August 2026, not seasonally adjusted. Latest: Warehousing and storage, August 2026: 75.4 thousand jobs, published by the U.S. Bureau of Labor Statistics.
- Fact75.4 thousand jobsWarehousing and storageAugust 2026 preliminary
- RapidShips analysis−2.8%Change from August 2025(75.4 ÷ 77.6) − 1
- CoverageJan 2017 to Aug 2026New JerseyMonthly data
- Warehousing and storage
- Truck transportation
Data table: all 116 months
| Month | Warehousing and storage | Truck transportation | Transportation, warehousing and utilities (all) |
|---|---|---|---|
| August 2026 | 75.4 p | 36.4 p | 250.2 p |
| July 2026 | 75.5 | 36.6 | 252.1 |
| June 2026 | 75.6 | 37.0 | 256.3 |
| May 2026 | 74.9 | 36.5 | 254.4 |
| April 2026 | 74.4 | 36.2 | 251.2 |
| March 2026 | 74.8 | 36.3 | 252.4 |
| February 2026 | 75.6 | 36.5 | 254.3 |
| January 2026 | 77.9 | 36.4 | 260.1 |
| December 2025 | 80.9 | 37.4 | 270.7 |
| November 2025 | 82.1 | 37.3 | 265.2 |
| October 2025 | 79.2 | 37.9 | 257.8 |
| September 2025 | 78.0 | 37.8 | 255.3 |
| August 2025 | 77.6 | 37.6 | 248.4 |
| July 2025 | 76.9 | 37.9 | 249.6 |
| June 2025 | 74.4 | 38.3 | 252.8 |
| May 2025 | 74.0 | 38.0 | 251.7 |
| April 2025 | 74.1 | 37.8 | 250.2 |
| March 2025 | 74.6 | 37.5 | 252.9 |
| February 2025 | 76.0 | 37.6 | 258.5 |
| January 2025 | 78.4 | 37.7 | 261.9 |
| December 2024 | 80.4 | 38.9 | 273.8 |
| November 2024 | 81.4 | 38.9 | 270.3 |
| October 2024 | 77.9 | 38.6 | 259.4 |
| September 2024 | 76.6 | 38.6 | 255.2 |
| August 2024 | 76.2 | 38.3 | 246.2 |
| July 2024 | 75.3 | 38.2 | 247.5 |
| June 2024 | 76.2 | 39.0 | 255.7 |
| May 2024 | 75.6 | 38.6 | 253.4 |
| April 2024 | 75.3 | 38.1 | 251.7 |
| March 2024 | 77.1 | 38.4 | 253.5 |
| February 2024 | 78.2 | 38.5 | 256.0 |
| January 2024 | 80.8 | 39.0 | 262.4 |
| December 2023 | 85.4 | 40.3 | 278.0 |
| November 2023 | 85.9 | 40.5 | 275.0 |
| October 2023 | 82.8 | 39.9 | 264.9 |
| September 2023 | 81.8 | 40.1 | 260.7 |
| August 2023 | 79.6 | 39.4 | 249.2 |
| July 2023 | 78.5 | 39.8 | 248.8 |
| June 2023 | 79.9 | 40.4 | 256.6 |
| May 2023 | 79.1 | 40.3 | 254.7 |
| April 2023 | 78.0 | 40.3 | 249.8 |
| March 2023 | 80.7 | 40.5 | 257.5 |
| February 2023 | 82.3 | 40.8 | 259.4 |
| January 2023 | 84.6 | 41.4 | 265.3 |
| December 2022 | 82.9 | 43.1 | 275.9 |
| November 2022 | 84.2 | 43.3 | 272.3 |
| October 2022 | 81.9 | 43.1 | 264.0 |
| September 2022 | 81.1 | 42.7 | 260.4 |
| August 2022 | 81.2 | 42.4 | 254.6 |
| July 2022 | 81.8 | 42.4 | 255.1 |
| June 2022 | 83.3 | 42.6 | 260.9 |
| May 2022 | 83.7 | 42.1 | 259.8 |
| April 2022 | 85.2 | 41.8 | 260.1 |
| March 2022 | 88.5 | 41.8 | 265.3 |
| February 2022 | 89.7 | 41.5 | 267.4 |
| January 2022 | 85.4 | 41.1 | 262.6 |
| December 2021 | 87.2 | 42.2 | 271.9 |
| November 2021 | 85.5 | 42.1 | 264.4 |
| October 2021 | 82.5 | 40.9 | 252.4 |
| September 2021 | 76.1 | 39.8 | 238.8 |
| August 2021 | 74.7 | 39.2 | 229.7 |
| July 2021 | 73.9 | 39.2 | 229.0 |
| June 2021 | 72.0 | 38.9 | 230.2 |
| May 2021 | 71.6 | 38.6 | 227.3 |
| April 2021 | 73.2 | 38.2 | 227.8 |
| March 2021 | 73.7 | 37.6 | 228.1 |
| February 2021 | 74.9 | 37.3 | 229.7 |
| January 2021 | 75.5 | 37.6 | 235.3 |
| December 2020 | 75.4 | 38.3 | 241.0 |
| November 2020 | 74.5 | 38.0 | 234.9 |
| October 2020 | 72.9 | 37.6 | 229.9 |
| September 2020 | 74.4 | 37.3 | 224.2 |
| August 2020 | 75.0 | 36.9 | 218.7 |
| July 2020 | 77.5 | 36.2 | 219.4 |
| June 2020 | 73.4 | 35.1 | 214.7 |
| May 2020 | 73.0 | 33.6 | 211.5 |
| April 2020 | 66.5 | 32.4 | 199.3 |
| March 2020 | 65.3 | 37.9 | 226.4 |
| February 2020 | 65.7 | 37.8 | 227.9 |
| January 2020 | 66.4 | 37.9 | 232.5 |
| December 2019 | 73.3 | 38.7 | 245.0 |
| November 2019 | 76.2 | 38.7 | 243.9 |
| October 2019 | 67.8 | 38.7 | 231.6 |
| September 2019 | 65.3 | 38.6 | 225.8 |
| August 2019 | 64.6 | 38.7 | 217.7 |
| July 2019 | 62.4 | 38.7 | 217.2 |
| June 2019 | 61.2 | 38.4 | 221.4 |
| May 2019 | 59.9 | 38.0 | 218.6 |
| April 2019 | 58.5 | 37.5 | 216.1 |
| March 2019 | 60.1 | 37.1 | 217.4 |
| February 2019 | 60.9 | 37.5 | 219.0 |
| January 2019 | 62.9 | 37.5 | 222.3 |
| December 2018 | 70.1 | 38.6 | 234.9 |
| November 2018 | 70.2 | 38.7 | 232.2 |
| October 2018 | 61.7 | 38.6 | 220.1 |
| September 2018 | 57.0 | 38.4 | 213.5 |
| August 2018 | 57.1 | 38.4 | 206.6 |
| July 2018 | 57.0 | 38.5 | 207.9 |
| June 2018 | 56.4 | 38.5 | 213.2 |
| May 2018 | 56.7 | 37.7 | 212.4 |
| April 2018 | 56.6 | 36.9 | 210.3 |
| March 2018 | 57.1 | 36.5 | 210.5 |
| February 2018 | 58.1 | 36.1 | 211.1 |
| January 2018 | 59.7 | 36.4 | 213.6 |
| December 2017 | 64.1 | 37.5 | 226.0 |
| November 2017 | 62.7 | 37.6 | 220.3 |
| October 2017 | 57.6 | 37.3 | 212.5 |
| September 2017 | 56.6 | 37.3 | 210.3 |
| August 2017 | 53.8 | 37.2 | 200.7 |
| July 2017 | 52.0 | 37.4 | 200.4 |
| June 2017 | 50.5 | 37.5 | 205.4 |
| May 2017 | 49.0 | 36.7 | 202.5 |
| April 2017 | 48.4 | 36.1 | 199.2 |
| March 2017 | 46.8 | 35.8 | 197.9 |
| February 2017 | 46.8 | 35.8 | 198.1 |
| January 2017 | 47.2 | 35.9 | 199.8 |
p = preliminary, as flagged by the source.
- Source
- U.S. Bureau of Labor Statistics Primary official statistics
Series SMU34000004349300001, SMU34000004348400001, SMU34000004300000001; BLS Public Data API, version 2 (timeseries data); State and Metro Area Employment, Hours, and Earnings (next release... - Date range
- January 2017 to August 2026
- Last verified
- September 30, 2026 (values re-checked against the source by the build)
- Update frequency
- Monthly. Next expected: October 20, 2026.
- Geography
- New Jersey
- Unit
- all employees, in thousands, not seasonally adjusted
- Methodology
- How the figures were collected and the Data Center methodology
- Limitations
- What this data cannot tell you
- Licence
- U.S. federal government work in the public domain. BLS asks that it be cited as the source. Terms
Cite this data
RapidShips. "New Jersey transportation, trucking and warehousing jobs, 2017 to 2026." Data period January 2017 to August 2026. Source: U.S. Bureau of Labor Statistics, Current Employment Statistics (State and Area) (https://data.bls.gov/timeseries/SMU34000004349300001). RapidShips Freight Data: https://rapidships.com/freight-data/new-jersey-freight-employment/#ds-bls-ces-nj-freight-jobs. Retrieved September 30, 2026; last updated September 30, 2026.
Download: CSV JSON U.S. federal government work in the public domain. BLS asks that it be cited as the source.
How the figures were collected
- State and Area Employment series SMU34000004300000001 (transportation, warehousing and utilities), SMU34000004348400001 (truck transportation) and SMU34000004349300001 (warehousing and storage), all employees in thousands, not seasonally adjusted, from the BLS Public Data API.
- BLS labels the first series "Transportation, Warehousing, and Utilities"; it includes utilities, so it is not a pure freight count. Year-over-year changes are RapidShips analysis.
Limitations
- The latest month is preliminary (marked p) and BLS benchmarks state estimates every year, so recent values can change.
- Counts jobs located in New Jersey by the industry of the establishment. The warehousing and storage industry (NAICS 493) covers establishments that "provide facilities to store goods" and "do not sell the goods they handle", so a distribution center run by a company that sells the goods may be counted in another industry.
- Not seasonally adjusted: warehousing jobs rise every autumn with peak season, so compare the same month across years.
- Different from County Business Patterns, which counts mid-March employees from administrative records; the two programs do not give the same number.